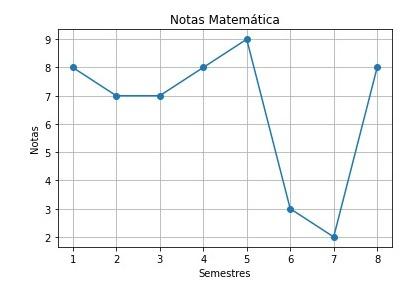
Somente adicionei o "plt.grid()"
import matplotlib.pyplot as plt
x = list (range(1,9))
y = notas_matematica
plt.plot (x, y, marker= 'o')
plt.title ('Notas Matemática')
plt.xlabel('Semestres')
plt.ylabel('Notas')
plt.grid()
plt.show()
Ficando assim:

Somente adicionei o "plt.grid()"
import matplotlib.pyplot as plt
x = list (range(1,9))
y = notas_matematica
plt.plot (x, y, marker= 'o')
plt.title ('Notas Matemática')
plt.xlabel('Semestres')
plt.ylabel('Notas')
plt.grid()
plt.show()Ficando assim:

Olá,
Excelente dica, obrigado por compartilhar !
Muito bom! parábens...