Solucionado (ver solução)
Solucionado
(ver solução)
2
respostas

Plotly + Função que contém argumentos não obrigatórios

Quando desenvolvi a função, percebi que nem todos os argumentos são obrigatórios. Com isso, defini como obrigatórios apenas o dataframe e os eixos x e y. Eu utilizei o Plotly ao invés do Seaborn e obtive um resultado bastante interessante, como podemos ver no código abaixo : )


def line_plotter(df, x, y, title = False, x_title = False, y_title = False, color = False):
    if title and x_title and y_title and color:
        fig = px.line(
              df, 
              x=x, 
              y=y,
              color_discrete_sequence=[color],
              width=860,
              height=550,
              )
        fig.layout.title = title
        fig.update_layout(xaxis_title=x_title, yaxis_title=y_title, font_size=14)
        fig.layout.template = 'plotly_dark'
        fig.show()
    elif title and x_title and y_title:
        fig = px.line(
              df, 
              x=x, 
              y=y,
              width=860,
              height=550,
              )
        fig.layout.title = title
        fig.update_layout(xaxis_title=x_title, yaxis_title=y_title, font_size=14)
        fig.layout.template = 'plotly_dark'
        fig.show()
    elif title and x_title and color:
        fig = px.line(
              df, 
              x=x, 
              y=y,
              color_discrete_sequence=[color],
              width=860,
              height=550,
              )
        fig.layout.title = title
        fig.update_layout(xaxis_title=x_title, font_size=14)
        fig.layout.template = 'plotly_dark'
        fig.show()
    elif title and y_title and color:
        fig = px.line(
              df, 
              x=x, 
              y=y,
              color_discrete_sequence=[color],
              width=860,
              height=550,
              )
        fig.layout.title = title
        fig.update_layout(yaxis_title=y_title, font_size=14)
        fig.layout.template = 'plotly_dark'
        fig.show()
    elif title and x_title:
        fig = px.line(
              df, 
              x=x, 
              y=y,
              width=860,
              height=550,
              )
        fig.layout.title = title
        fig.update_layout(xaxis_title=x_title, font_size=14)
        fig.layout.template = 'plotly_dark'
        fig.show()
    elif title and y_title:
        fig = px.line(
              df, 
              x=x, 
              y=y,
              width=860,
              height=550,
              )
        fig.layout.title = title
        fig.update_layout(yaxis_title=y_title, font_size=14)
        fig.layout.template = 'plotly_dark'
        fig.show()
    elif title and color:
        fig = px.line(
              df, 
              x=x, 
              y=y,
              color_discrete_sequence=[color],
              width=860,
              height=550,
              )
        fig.layout.title = title
        fig.layout.template = 'plotly_dark'
        fig.show()
    elif title:
        fig = px.line(
              df, 
              x=x, 
              y=y,
              width=860,
              height=550,
              )
        fig.layout.title = title
        fig.layout.template = 'plotly_dark'
        fig.show()
    else:
        fig = px.line(
              df, 
              x=x, 
              y=y,
              width=860,
              height=550,
              )
        fig.layout.template = 'plotly_dark'
        fig.show()

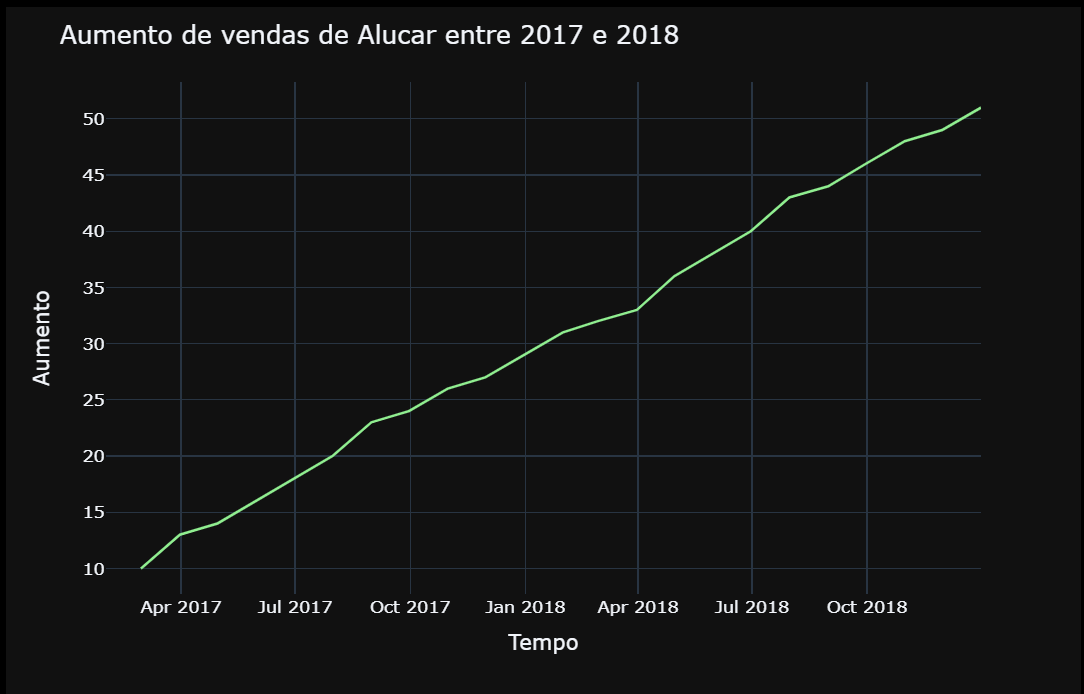
Aqui, podemos ver a chamada da função e seu output:


    line_plotter(
          df=alucar_df,
          x='mes',
          y='aumento',
          title='Aumento de vendas de Alucar entre 2017 e 2018',
          x_title='Tempo',
          y_title='Aumento',
          color='lightgreen',
         )
Insira aqui a descrição dessa imagem para ajudar na acessibilidade

2 respostas
solução!

Olá Naomi, tudo bem? Espero que sim!

Realmente os gráficos ficam bem mais interessantes com o uso da biblioteca Plotly. Ficou bem legal.

Em funções com parâmetros opcionais, você pode manter um valor padrão para caso não seja passado nenhum valor. Dessa maneira somente será modificada caso você passe um valor específico no momento de iniciar a função.

Exemplo:

def line_plotter(df, x, y, title = "", x_title = "", y_title = "", color = None):
        fig = px.line(
              df, 
              x=x, 
              y=y,
              color_discrete_sequence=color,
              width=860,
              height=550,
              )
        fig.layout.title = title
        fig.update_layout(xaxis_title=x_title, yaxis_title=y_title, font_size=14)
        fig.layout.template = 'plotly_dark'
        fig.show()

Ao usar o parâmetro color = None, a própria função px.line se adequa e utiliza as cores padrão.

Bons estudos!

Ah, muito obrigada por compartilhar, João! Agora sim ficou perfeito : )