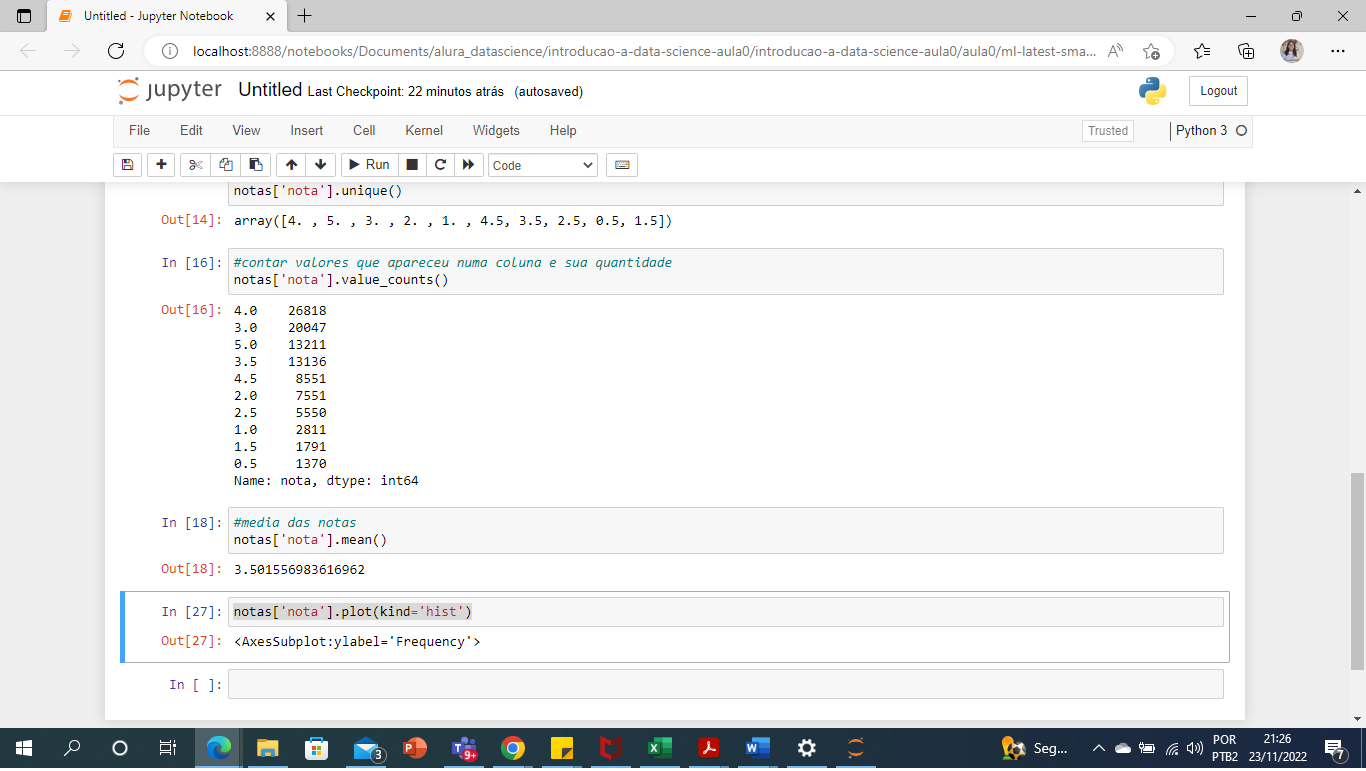
Olá, estou usando o Jupyter notebook para acompanhar o curso e qu ando tento plotar o histograma notas['nota'].plot(kind='hist')
aparece essa mensagem AxesSubplot:ylabel='Frequency'

Tentei fazer o teste no google colab e por lá o histograma é plotado, alguém poderia me ajudar?


