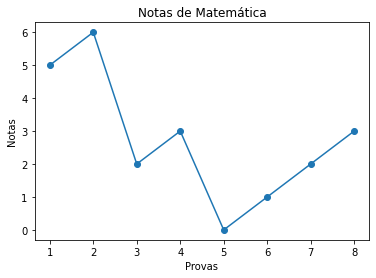
Segue exercício:
import matplotlib.pyplot as plt

provas_mat = list(range(1,9))

notas_mat = []

for n in range(8):
  notas_mat.append(randrange(0,11))

notas_mat
plt.plot(x,y, marker='o')
plt.title('Notas de Matemática')
plt.xlabel('Provas')
plt.ylabel('Notas')
plt.show()


