
df_va_adespss = df_pib.copy()
df_va_adespss = df_va_adespss[['ano','regiao','va_adespss']]
df_va_adespss = pd.crosstab(index = df_va_adespss.ano, columns = df_va_adespss.regiao,
values = df_va_adespss.va_adespss, aggfunc = 'sum')
df_va_adespss = (df_va_adespss / 1e9).round(2)
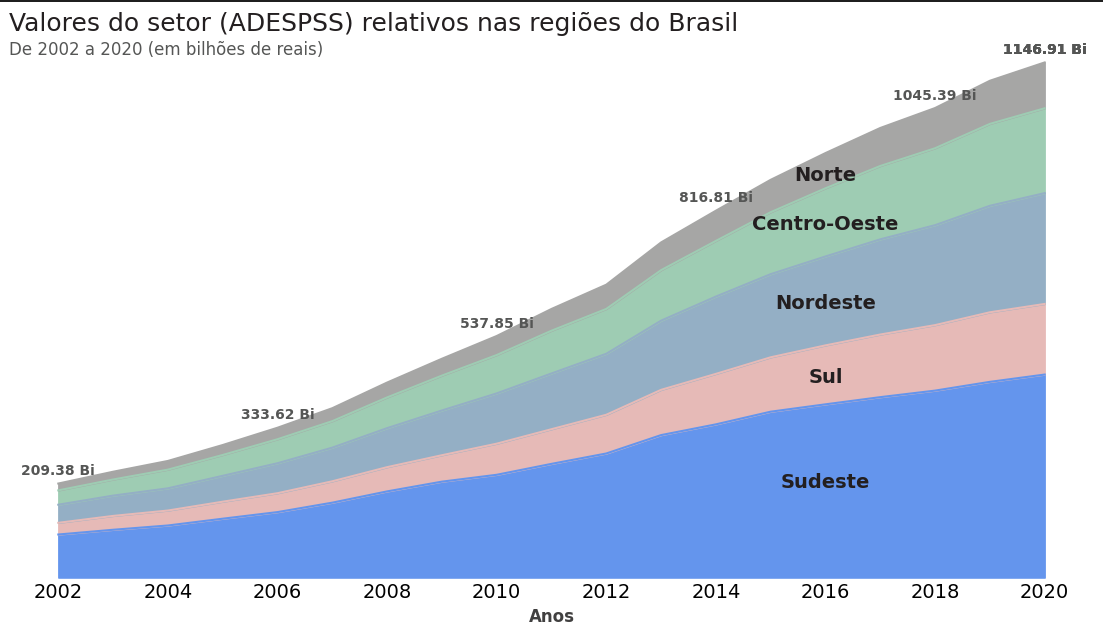
df_va_adespss = df_va_adespss[["Sudeste", "Sul", "Nordeste", "Centro-Oeste", "Norte"]]
df_va_adespss.head()
fig, ax = plt.subplots(figsize=(14,7))
cores = [AZUL3, VERMELHO2, AZUL5 ,VERDE3, CINZA4]
cor = ['k']
df_va_adespss.plot(kind = 'area', stacked = True, color = cores, ax = ax, xticks = range(2002, 2021, 2))
ax.set_title('Valores do setor (ADESPSS) relativos nas regiões do Brasil', fontsize = 18, color = CINZA1, loc = 'left')
ax.text(0.29, 0.98, 'De 2002 a 2020 (em bilhões de reais)', transform=ax.transAxes, color= CINZA3, fontsize=12, ha='right', va='center')
ax.xaxis.set_tick_params(labelsize = 14, color = CINZA2)
ax.set_xlabel('Anos', fontsize = 12, color = CINZA2, fontweight = 'bold')
ax.legend().remove()
ax.set_frame_on(False)
regioes = df_va_adespss.columns
y_pos = [200, 435, 600, 775, 885] # posições dos labels com relação ao eixo y
for i in range(len(regioes)):
ax.text(2016, y_pos[i], f'{regioes[i]}', color = '#231F20', weight = "bold", fontsize = 14, ha="center", transform=ax.transData)
plt.ylim(0, 1200)
ax.get_yaxis().set_visible(False)
ax.tick_params(axis='both', which='both', length=0)
agregado_ano = list(df_va_adespss.sum(axis = 1).round(2))
for i in range(0, len(df_va_adespss.index), 4):
ax.text(x = df_va_adespss.index[i], y = agregado_ano[i] + 20, s = f"{agregado_ano[i]} Bi", color = CINZA3, weight = "bold", fontsize = 10, ha="center")
ax.text(x = df_va_adespss.index[-1], y = agregado_ano[-1] + 20, s = f"{agregado_ano[-1]} Bi", color = CINZA3, weight = "bold", fontsize = 10, ha="center")
plt.show()
Eu fiz dessa forma está incorreto?


