# Recarregar bibliotecas após o reset do ambiente
import matplotlib.pyplot as plt
import pandas as pd
# Simulando dados do desafio 1 - Faturamento por região
df_regiao = pd.DataFrame({
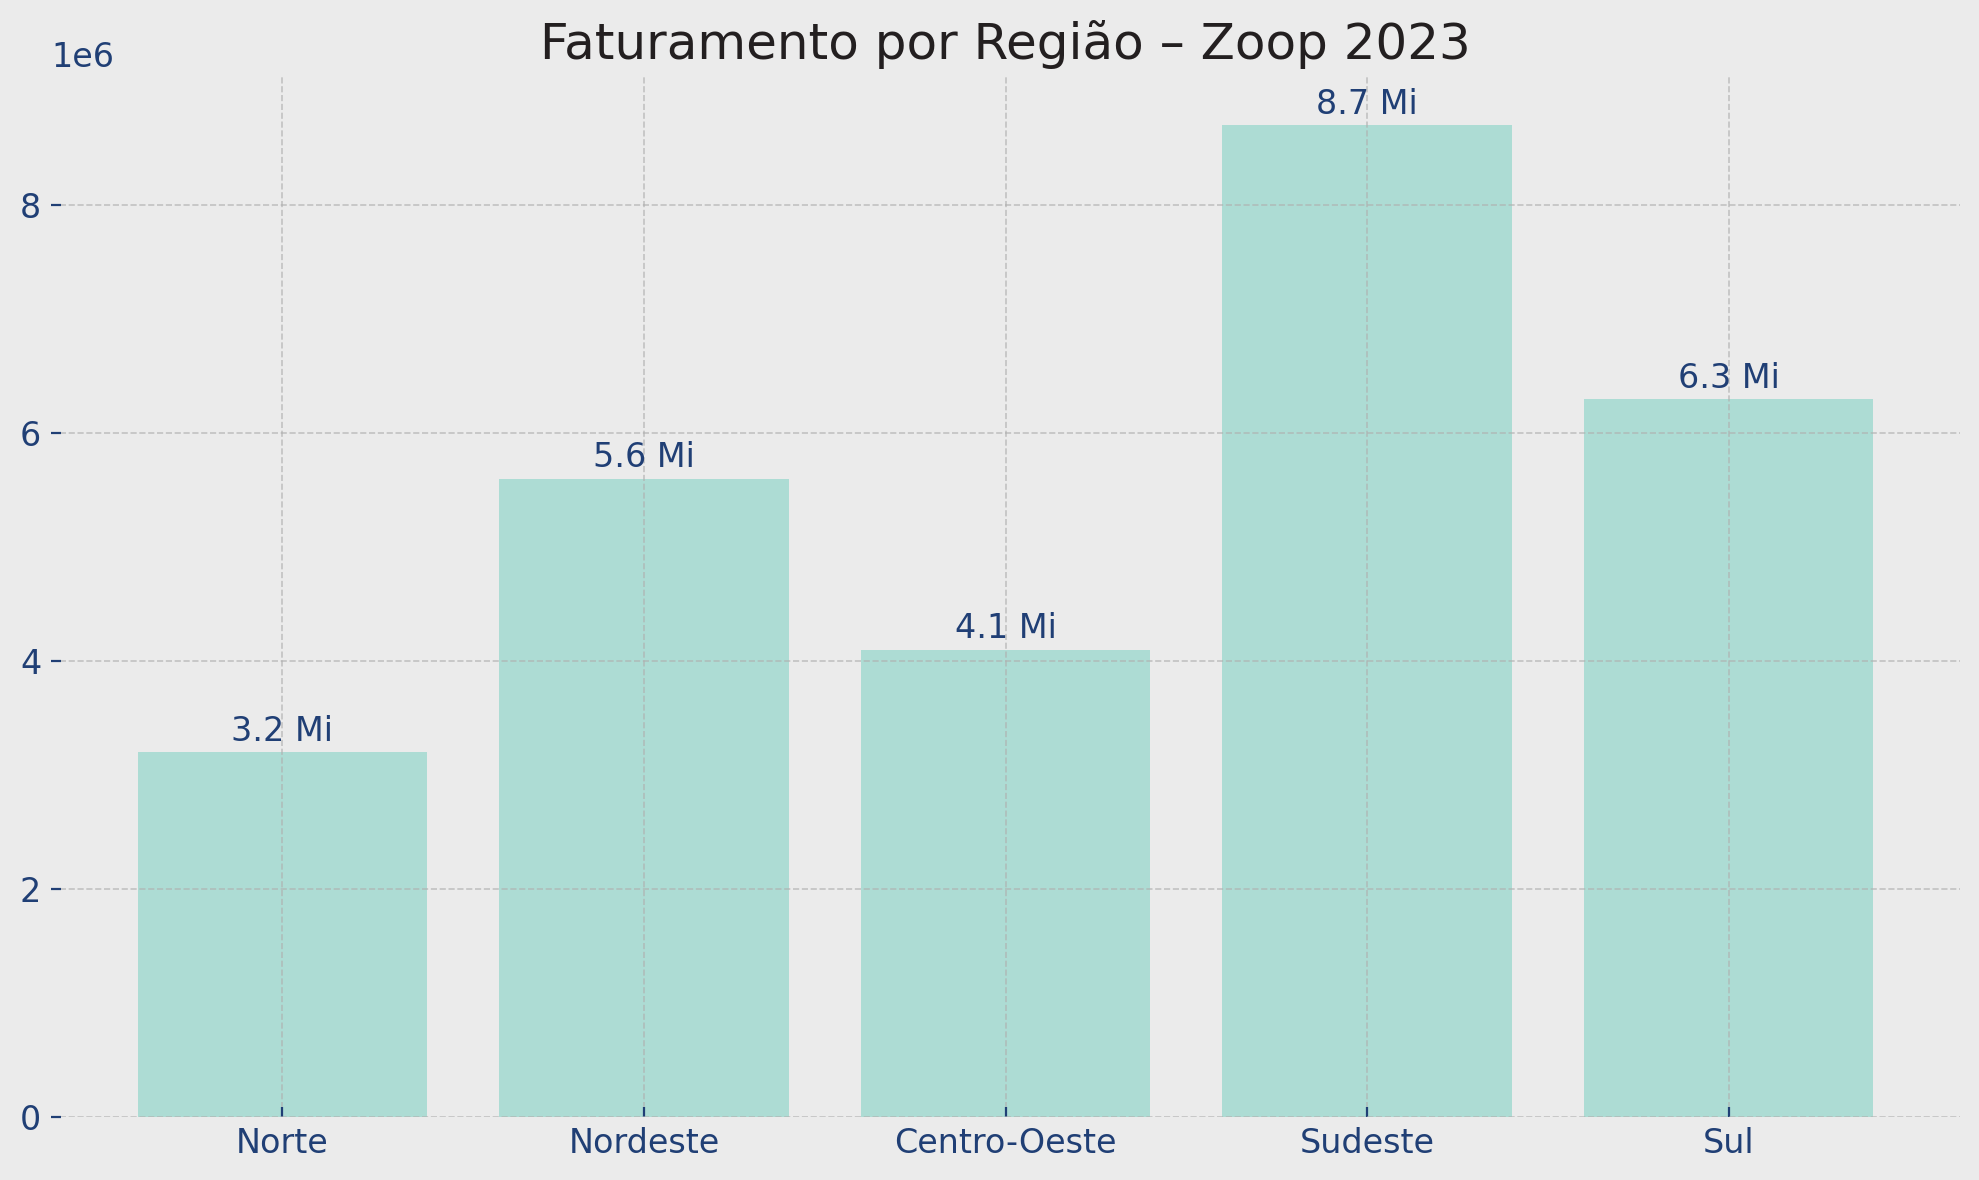
'regiao': ['Norte', 'Nordeste', 'Centro-Oeste', 'Sudeste', 'Sul'],
'faturamento': [3.2e6, 5.6e6, 4.1e6, 8.7e6, 6.3e6]
})
# Paleta de cores Zoop
AZUL_1 = "#203f75"
AQUA_1 = "#addcd4"
AQUA_3 = "#96bfb9"
CINZA_1 = "#ebebeb"
CINZA_5 = "#231f20"
# Plot do desafio 1
fig, ax = plt.subplots(figsize=(10, 6), facecolor=CINZA_1)
ax.set_facecolor(CINZA_1)
bars = ax.bar(df_regiao['regiao'], df_regiao['faturamento'], color=AQUA_1)
# Adicionando os valores acima das barras
for bar in bars:
height = bar.get_height()
ax.text(
bar.get_x() + bar.get_width()/2,
height + 1e5,
f"{height/1e6:.1f} Mi",
ha='center',
fontsize=12,
color=AZUL_1
)
# Título e rótulos
ax.set_title("Faturamento por Região – Zoop 2023", fontsize=18, color=CINZA_5)
ax.tick_params(axis='x', labelsize=12, colors=AZUL_1)
ax.tick_params(axis='y', labelsize=12, colors=AZUL_1)
ax.set_xlabel("")
ax.set_ylabel("")
# Remover bordas
for spine in ['top', 'right', 'left', 'bottom']:
ax.spines[spine].set_visible(False)
plt.tight_layout()
plt.show()