## Resolução padrão
# -*- coding: utf-8 -*-
from urllib.request import urlopen
import numpy as np
import matplotlib.pyplot as plt

def proximo_valido(coluna, indice, sentido='antes'):
    if sentido == 'antes':
        for i in range(indice - 1, -1, -1):
            if not np.isnan(coluna[i]):
                return coluna[i]
    elif sentido == 'depois':
        for i in range(indice + 1, len(coluna)):
            if not np.isnan(coluna[i]):
                return coluna[i]
    return None

def preencher_nan_com_media_vizinhos(array):
    for i in range(array.shape[0]):
        for j in range(array.shape[1]):
            if np.isnan(array[i, j]):
                valores_validos = []
                antes = proximo_valido(array[:, j], i, sentido='antes')
                depois = proximo_valido(array[:, j], i, sentido='depois')
                if antes is not None:
                    valores_validos.append(antes)
                if depois is not None:
                    valores_validos.append(depois)
                if valores_validos:
                    array[i, j] = np.mean(valores_validos)
    return array

def calcular_coeficientes(array):
    x = array[:, 0]
    y = array[:, 1]
    n = len(x)
    soma_x = np.sum(x)
    soma_y = np.sum(y)
    soma_xy = np.sum(x * y)
    soma_x2 = np.sum(x * x)
    m = (n * soma_xy - soma_x * soma_y) / (n * soma_x2 - soma_x**2)
    b = (soma_y - m * soma_x) / n
    return m, b

# === Carregamento e preparo dos dados ===

url = 'https://raw.githubusercontent.com/allanspadini/numpy/dados/citrus.csv'
dados = np.loadtxt(urlopen(url), delimiter=',', skiprows=1, usecols=[1, 2])
dados = preencher_nan_com_media_vizinhos(dados)

laranjas_array = dados[:5000]
toranjas_array = dados[5000:]

laranjas_array = laranjas_array[laranjas_array[:, 0].argsort()]
toranjas_array = toranjas_array[toranjas_array[:, 0].argsort()]

# === Deslocar toranja no eixo x ===
margem = 0.2
deslocamento_x = laranjas_array[0, 0] - toranjas_array[0, 0] + margem
toranjas_array_deslocada = toranjas_array.copy()
toranjas_array_deslocada[:, 0] += deslocamento_x

# Coeficientes com dados deslocados
laranja_m, laranja_b = calcular_coeficientes(laranjas_array)
toranja_m, toranja_b = calcular_coeficientes(toranjas_array_deslocada)

# === Plotagem ===
fig, ax = plt.subplots(figsize=(10, 6))

# Linhas das frutas
ax.plot(laranjas_array[:, 0], laranjas_array[:, 1], color='orange', linewidth=1, label='Laranjas')
ax.plot(toranjas_array_deslocada[:, 0], toranjas_array_deslocada[:, 1], color='blue', linewidth=1, label='Toranjas')

# Linhas de tendência
x_laranja = laranjas_array[:, 0]
ax.plot(x_laranja, laranja_m * x_laranja + laranja_b, color='orange', linestyle='--', linewidth=1, label='Laranja (tendência)')

x_toranja = toranjas_array_deslocada[:, 0]
ax.plot(x_toranja, toranja_m * x_toranja + toranja_b, color='blue', linestyle='--', linewidth=1, label='Toranja (tendência)')

# Eixos e título
ax.set_title('Comparação de Laranjas e Toranjas (com deslocamento)')
ax.set_xlabel('Diâmetro (cm)')
ax.set_ylabel('Peso (g)')
ax.legend()
plt.show()
## Otimizado
import numpy as np
import matplotlib.pyplot as plt
from urllib.request import urlopen
# === Carregar dados e interpolar ===
url = 'https://raw.githubusercontent.com/allanspadini/numpy/dados/citrus.csv'
dados = np.loadtxt(urlopen(url), delimiter=',', skiprows=1, usecols=[1, 2])
def interpolar_nans(arr):
for j in range(arr.shape[1]):
col = arr[:, j]
nans = np.isnan(col)
idx = np.arange(len(col))
col[nans] = np.interp(idx[nans], idx[~nans], col[~nans])
return arr
dados = interpolar_nans(dados)
# === Separar e ordenar ===
lar = np.sort(dados[:5000], axis=0)
tor = np.sort(dados[5000:], axis=0)
# === Deslocar toranja ===
margem = 0.2
dx = lar[0, 0] - tor[0, 0] + margem
tor[:, 0] += dx
# === Regressão linear ===
m_lar, b_lar = np.polyfit(lar[:, 0], lar[:, 1], 1)
m_tor, b_tor = np.polyfit(tor[:, 0], tor[:, 1], 1)
# === Plotagem ===
fig, ax = plt.subplots(figsize=(10, 6))
ax.plot(lar[:, 0], lar[:, 1], color='orange', linewidth=1, label='Laranjas')
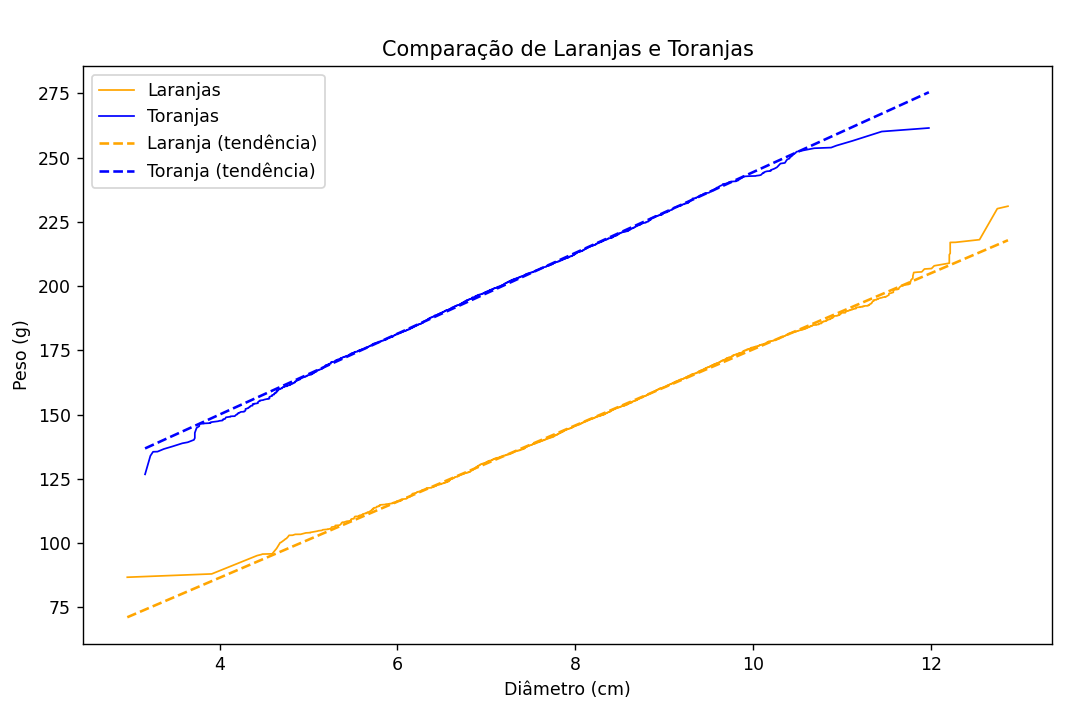
ax.plot(tor[:, 0], tor[:, 1], color='blue', linewidth=1, label='Toranjas')
ax.plot(lar[:, 0], m_lar * lar[:, 0] + b_lar, 'orange', linestyle='--', label='Laranja (tendência)')
ax.plot(tor[:, 0], m_tor * tor[:, 0] + b_tor, 'blue', linestyle='--', label='Toranja (tendência)')
ax.set(title='Comparação de Laranjas e Toranjas', xlabel='Diâmetro (cm)', ylabel='Peso (g)')
ax.legend()
plt.show()
Resultado