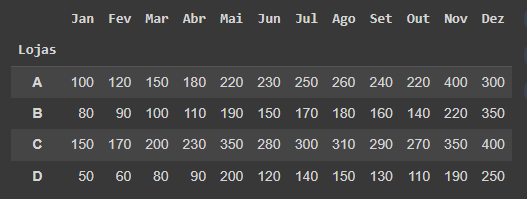
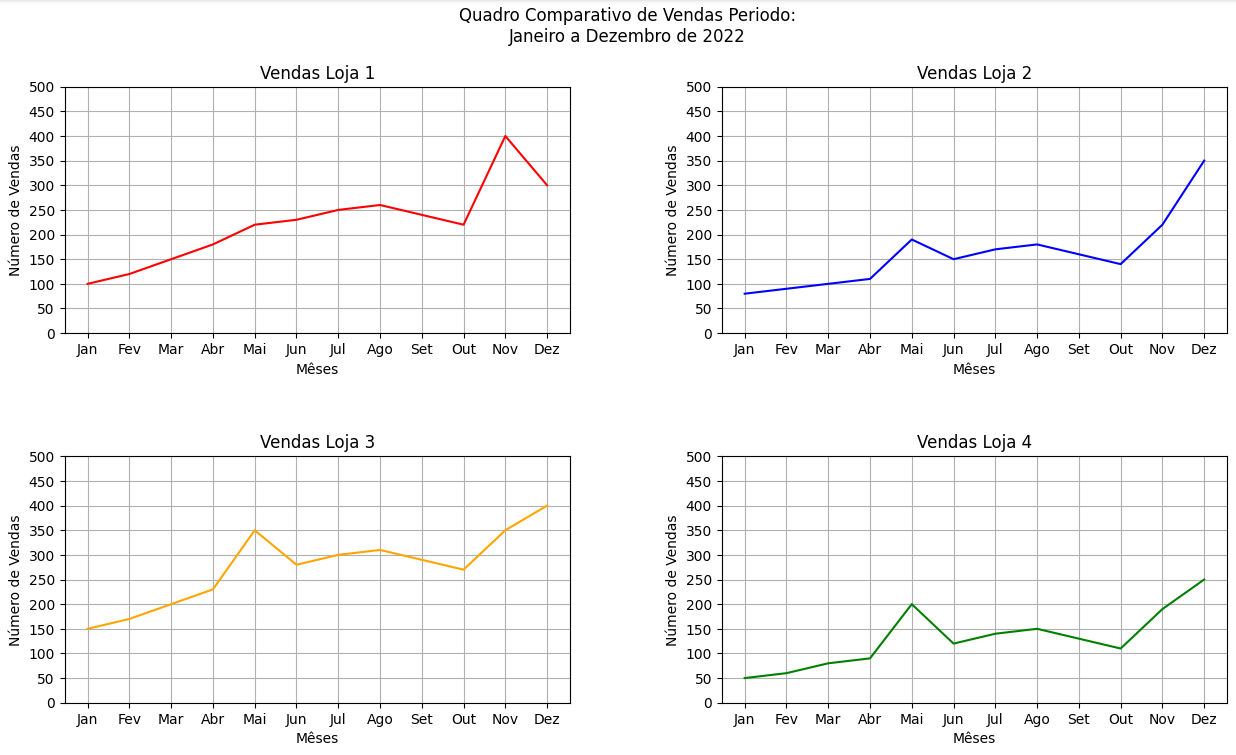
Segue a forma que resolvi o desafio dos dados de vendas de diferentes lojas:
import pandas as pd
import matplotlib.pyplot as plt
lojas = ['A', 'B', 'C', 'D']

vendas_2022 = {'Jan': [100, 80, 150, 50],
    'Fev': [120, 90, 170, 60],
    'Mar': [150, 100, 200, 80],
    'Abr': [180, 110, 230, 90],
    'Mai': [220, 190, 350, 200],
    'Jun': [230, 150, 280, 120],
    'Jul': [250, 170, 300, 140],
    'Ago': [260, 180, 310, 150],
    'Set': [240, 160, 290, 130],
    'Out': [220, 140, 270, 110],
    'Nov': [400, 220, 350, 190],
    'Dez': [300, 350, 400, 250]
}
df_vendas_2022 = pd.DataFrame(vendas_2022, index=lojas)
df_vendas_2022.insert(0, "Lojas", df_vendas_2022.index)
df_vendas_2022 = df_vendas_2022.set_index("Lojas")
df_vendas_2022

fig, axs = plt.subplots(2,2, figsize=(15,8))
fig.subplots_adjust(hspace=0.5, wspace=0.3)
fig.suptitle('Quadro Comparativo de Vendas Periodo:\nJaneiro a Dezembro de 2022')

axs[0,0].plot(df_vendas_2022.loc['A'], color='red')
axs[0,0].set_title('Vendas Loja 1')

axs[0,1].plot(df_vendas_2022.loc['B'], color='blue')
axs[0,1].set_title('Vendas Loja 2')

axs[1,0].plot(df_vendas_2022.loc['C'], color='orange')
axs[1,0].set_title('Vendas Loja 3')

axs[1,1].plot(df_vendas_2022.loc['D'], color='green')
axs[1,1].set_title('Vendas Loja 4')

for ax in axs.flat:
  ax.yaxis.set_major_locator(plt.MultipleLocator(50))
  ax.set_xlabel('Mêses')
  ax.set_ylabel('Número de Vendas')
  ax.grid()

ymin = 0
ymax = 500

for ax in axs.ravel():
  ax.set_ylim(ymin, ymax)

plt.show()


