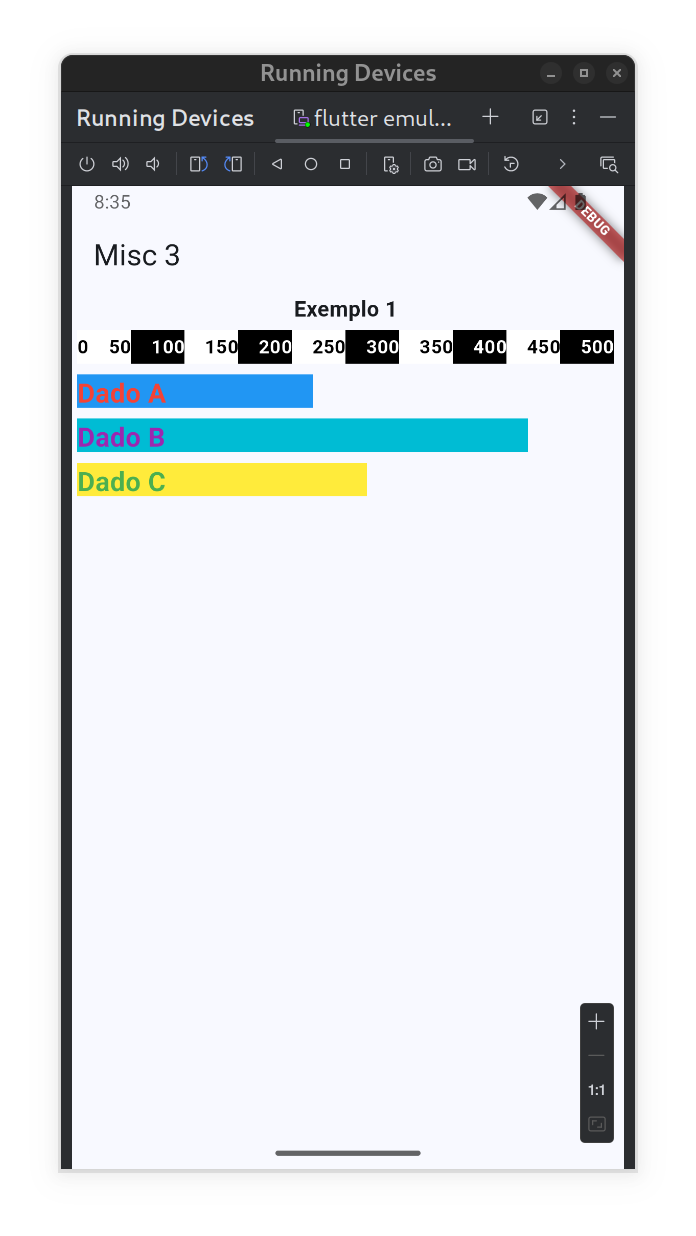
Para a atividade proposta, fiz um gráfico de barras:
class MyApp extends StatelessWidget {
  const MyApp({super.key});

  @override
  Widget build(BuildContext context) {
    return MaterialApp(
      title: 'Misc 3',
      theme: ThemeData(
        colorScheme: ColorScheme.fromSeed(seedColor: Colors.blue),
      ),
      home: Scaffold(
        appBar: AppBar(title: Text("Misc 3")),
        body: BarChart(
          title: "Exemplo 1",
          dataList: [
            ChartData(
              quantity: 220,
              description: "Dado A",
              barColor: Colors.blue,
              fontColor: Colors.red,
            ),
            ChartData(
              quantity: 420,
              description: "Dado B",
              barColor: Colors.cyan,
              fontColor: Colors.purple,
            ),
            ChartData(
              quantity: 270,
              description: "Dado C",
              barColor: Colors.yellow,
              fontColor: Colors.green,
            ),
          ],
        ),
      ),
    );
  }
}

class BarChart extends StatelessWidget {
  final String title;
  final List<ChartData> dataList;

  const BarChart({super.key, required this.title, required this.dataList});

  @override
  Widget build(BuildContext context) {
    int maxRef = maxRefValue(dataList.map((v) => v.quantity).toList());
    return Column(
      children: [
        Text(
          title,
          style: TextStyle(fontSize: 16, fontWeight: FontWeight.bold),
        ),
        Padding(
          padding: EdgeInsets.all(4),
          child: SizedBox(
            height: 25,
            width: 400,
            child: Row(
              children: [
                for (int i = 1; i <= 10; i++)
                  Stack(
                    children: [
                      Container(
                        height: 25,
                        width: 40,
                        color: i.isEven ? Colors.black : Colors.white,
                      ),
                      if (i == 1)
                        Container(
                          alignment: AlignmentDirectional.centerStart,
                          width: 40,
                          child: FittedBox(
                            child: Text(
                              "0",
                              style: TextStyle(
                                color: i.isEven ? Colors.white : Colors.black,
                                fontWeight: FontWeight.bold,
                              ),
                            ),
                          ),
                        ),
                      Container(
                        alignment: AlignmentDirectional.centerEnd,
                        width: 40,
                        child: FittedBox(
                          child: Text(
                            "${((i / 10) * maxRef).toInt()}",
                            style: TextStyle(
                              color: i.isEven ? Colors.white : Colors.black,
                              fontWeight: FontWeight.bold,
                            ),
                          ),
                        ),
                      ),
                    ],
                  ),
              ],
            ),
          ),
        ),
        for (var data in dataList) BarData(data: data, maxRef: maxRef),
      ],
    );
  }
}

class BarData extends StatelessWidget {
  final ChartData data;
  final int maxRef;

  const BarData({super.key, required this.data, required this.maxRef});

  @override
  Widget build(BuildContext context) {
    return Padding(
      padding: EdgeInsets.all(4),
      child: SizedBox(
        height: 25,
        width: 400,
        child: Stack(
          children: [
            Container(
              height: 25,
              width: (data.quantity / maxRef) * 400,
              color: data.barColor,
            ),
            Text(
              data.description,
              style: TextStyle(
                fontSize: 20,
                color: data.fontColor,
                fontWeight: FontWeight.bold,
              ),
            ),
          ],
        ),
      ),
    );
  }
}

class ChartData {
  final int quantity;
  final String description;
  final Color barColor;
  final Color fontColor;

  const ChartData({
    required this.quantity,
    required this.description,
    required this.barColor,
    required this.fontColor,
  });
}

int maxRefValue(List<int> values) {
  values.sort();
  int max = values.last;
  int power = pow(10, max.toString().length - 1).toInt();
  int threshold = (max ~/ power < 5) ? 5 : 10;
  return power * threshold;
}