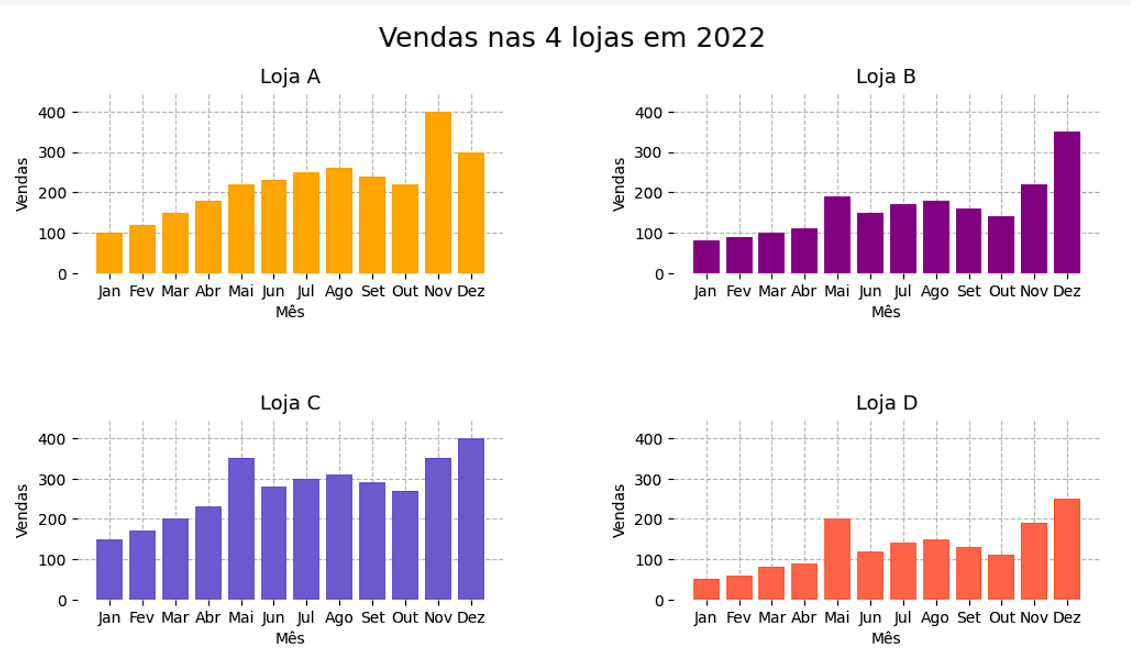
fig, axs = plt.subplots(2,2, figsize=(12,6))
fig.suptitle('Vendas nas 4 lojas em 2022', fontsize=18)
fig.subplots_adjust(hspace=0.8, wspace=0.4)

cores = ['orange', 'purple', 'slateblue', 'tomato']

ymin = 0
ymax = 400

for i, ax in enumerate(axs.flat):
  loja = lojas[i]
  ax.bar(df.columns.to_list(), df.loc[loja], color=cores[i])
  ax.set_title(f"Loja {loja}", fontsize=13)
  ax.set_ylabel("Vendas")
  ax.set_xlabel("Mês")
  ax.grid(linestyle='--')
  ax.set_axisbelow(True)
  ax.set_frame_on(False)
  ax.set_ylim(y_min, y_max)

plt.show()
Saída:


