import matplotlib.patheffects as path_effects
#Gerando o gráfico
fig, ax = plt.subplots(figsize=(14,8))
#Definindo as cores do gráfico
cores = ['royalblue', 'orange', 'forestgreen', 'firebrick', 'darkmagenta']
#Personalizando o titulo superior
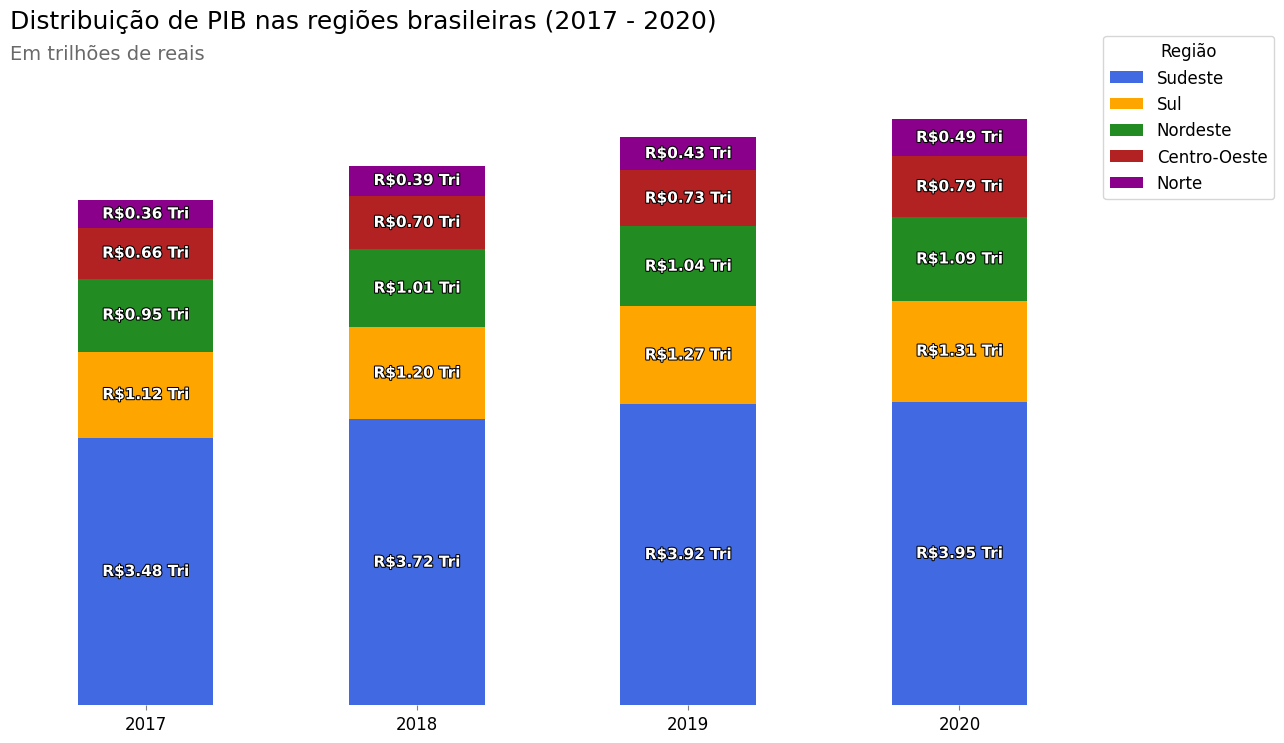
fig.suptitle('Distribuição de PIB nas regiões brasileiras (2017 - 2020)', fontsize=18, color='black', ha='right', x=0.63, y=.98)
#Criando o gráfico
pib_regioes_cross.plot(x='ano', kind='bar', stacked=True, ax=ax, color=cores)
#personalizando o gráfico
ax.set_title('Em trilhões de reais\n', color='dimgray', loc='left', fontsize=14)
ax.set_xlabel('')
ax.set_ylabel('')
ax.xaxis.set_tick_params(labelsize=12, color='grey', labelrotation=0)
ax.yaxis.set_tick_params(color='white')
ax.set_yticklabels([])
ax.set_frame_on(False)
ax.legend(bbox_to_anchor=(1,1.1), title='Região', title_fontsize=12, fontsize=12)
for container in ax.containers:
labels = [f'R${valor.get_height():.2f} Tri' for valor in container]
texts = ax.bar_label(container, label_type='center', labels=labels, size=11, color='white', fontweight='bold')
for text in texts:
text.set_path_effects([
path_effects.Stroke(linewidth=1.5, foreground='black'),
path_effects.Normal()
])
plt.show()