import matplotlib.pyplot as plt

plt.rc('axes', labelsize = 14)
plt.rc('xtick', labelsize = 12)
plt.rc('ytick', labelsize = 12)
plt.rc('font', size = 14)

plt.figure(figsize = (10,5))
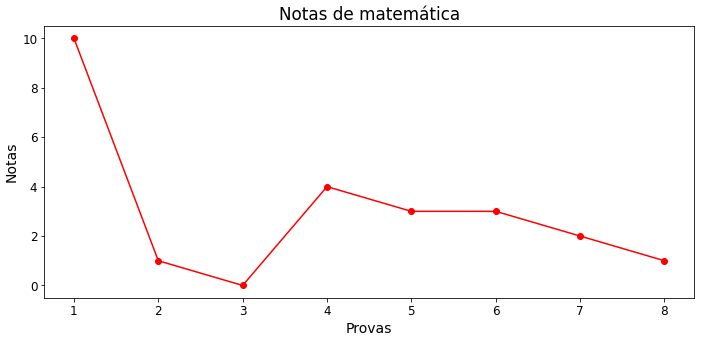
plt.plot(range(1,9), notas_matematica, '-or')

plt.title('Notas de matemática')
plt.xlabel('Provas')
plt.ylabel('Notas')

plt.tight_layout()
plt.show()
onde, no meu caso,
>>> notas_matematica = [rnd.randrange(0, 11) for notas in range(8)]
>>> notas_matematica
[10, 1, 0, 4, 3, 3, 2, 1]
Output:


