Perfeito! Qual seria a sua dúvida?
<!DOCTYPE html>
<html lang="pt-br">

<head>
    <meta charset="UTF-8">
    <title>Graficos</title>
</head>

<body>

    <canvas
        width="600"
        height="400"
    ></canvas>

    <script>

        tela = document.querySelector("canvas");
        var pincel = tela.getContext("2d");

        function desenhaRetangulo(x, y, largura, altura, cor) {

            pincel.fillStyle = cor;
            pincel.fillRect(x, y, largura, altura);
            pincel.strokeStyle = "black";
            pincel.strokeRect(x, y, largura, altura);
        }

        function desenhaTexto(texto, x, y) {

            pincel.font = "15px Georgia";
            pincel.fillStyle = "black";
            pincel.fillText(texto, x, y);
        }

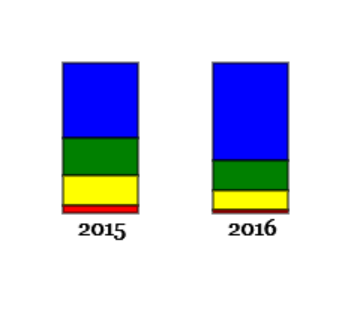
        var serie2015 = [50, 25, 20, 5];
        var serie2016 = [65, 20, 13, 2];
        var cores = ["blue", "green", "yellow", "red"];

        function desenhaBarra(x, y, serie, cores, texto) {

            var somaAltura = 0;

            for (var p = 0; p <= serie.length; p++) {

                altura = serie[p];
                desenhaRetangulo(x, y + somaAltura, 50, altura, cores[p]);
                somaAltura = somaAltura + altura;
                desenhaTexto(texto, x + 10, y + 115);

            }

        }

        desenhaBarra(50, 50, serie2015, cores, "2015");
        desenhaBarra(150, 50, serie2016, cores, "2016");

    </script>

</body>

</html>
Gerou os gráficos abaixo:


