import matplotlib.pyplot as plt             # as = apelido, então matplotlib - plt

from random import randrange, seed

seed(6)

randrange(0, 11)

notas_matematica = []

for notas in range(8):
  notas_matematica.append(randrange(0, 11))

x = list(range(1, 9))
y = notas_matematica
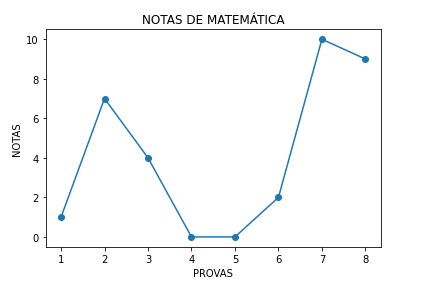
plt.plot(x, y, MARKER = 'o')
plt.title('NOTAS DE MATEMÁTICA')
plt.xlabel('PROVAS')
plt.ylabel('NOTAS')
plt.show()


