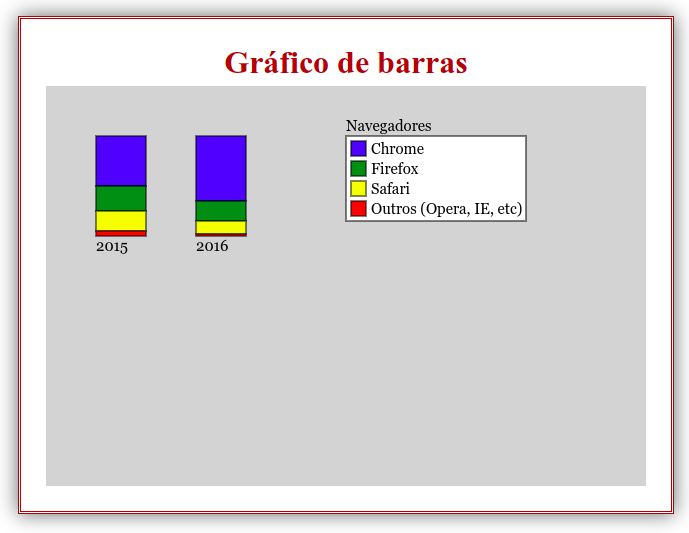
Boa noite! Segue minha solução própria para construção do gráfico conforme proposto no exercício.
<!DOCTYPE html>
<html lang="pt_BR">

<head>
    <meta charset="UTF-8">
    <meta http-equiv="X-UA-Compatible" content="IE=edge">
    <meta name="viewport" content="width=device-width, initial-scale=1.0">

    <style>
        * {
            margin: 0;
            padding: 0;
            box-sizing: border-box;

}

        body {
            display: flex;
            flex-direction: column;
            align-items: center;
            justify-content: center;
            height: 100vh;
        }

        div {
            display: flex;
            flex-direction: column;
            align-items: center;
            justify-content: center;
            border: 3px double brown;
            padding: 25px;
            box-shadow: 0 0 20px rgba(0, 0, 0, 0.6);
        }

        div h1 {
            margin-bottom: 5px;
            color: brown;
        }


        canvas {
            scale: (0.1);
            animation: .8s ease-in-out 0s 1 normal both running aparecimento
        }

        @keyframes aparecimento {
            from {
                transform: scale(0.1);
            }

            to {
                transform: scale(1.0);

            }
        }
    </style>

    <title>Gráficos</title>
</head>

<body>
    <div>
        <h1>Gráfico de barras</h1>
        <canvas width="600" height="400"></canvas>
    </div>

    <script>
        function getContext() {
            return document.querySelector("canvas").getContext("2d");
        }

        function drawRectangle(x, y, width, height, color, stroke) {
            let context = getContext();
            context.fillStyle = color;
            context.fillRect(x, y, width, height);

            if (stroke) {
                context.strokeStyle = "black";
                context.strokeRect(x, y, width, height);
            }
        }

        function drawText(x, y, text, maxWidth) {
            let context = getContext();
            context.fillStyle = "black";
            context.font = "15px Georgia"
            context.fillText(text, x, y, maxWidth)
        }

        function drawBar(x, y, serie, colors, text) {
            let heightBar = 0;

            for (let count = 0; count < serie.length; count++) {
                drawRectangle(x, y + heightBar, 50, serie[count], colors[count], true);
                heightBar = heightBar + serie[count];
            }

            drawText(x, y + heightBar + 15, text, 50);
        }

        function drawLegend(x, y, width, colors, content, text) {
            let pos = 0;

            drawText(x, y - 5, text, width);
            drawRectangle(x, y, width, 80 + 5, "white", true);

            for (let count = 0; count < content.length; count++) {
                drawRectangle(x + 5, y + 5 + pos, 15, 15, colors[count], true);
                drawText(x + 25, y + 18 + pos, content[count], width);
                pos = pos + 20;
            }
        }

        // Declaração das constantes com os valores a serem plotados.
        const serie2015 = [50, 25, 20, 5];
        const serie2016 = [65, 20, 13, 2];
        const colors = ["blue", "green", "yellow", "red"];
        const browsers = ["Chrome", "Firefox", "Safari", "Outros (Opera, IE, etc)"]

        // Desenha um retângulo inicial para exposição das informaçãoes.
        drawRectangle(0, 0, 600, 400, "lightgray", false);

        // Desenha os gráficos
        drawBar(50, 50, serie2015, colors, "2015");
        drawBar(150, 50, serie2016, colors, "2016");

        // Desenha a legenda.
        drawLegend(300, 50, 180, colors, browsers, "Navegadores");
    </script>
</body>

</html>


