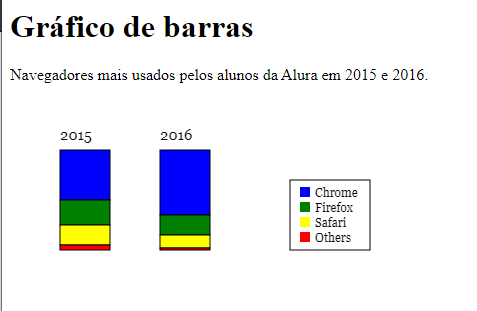
Resolvi adicionar uma legenda pra ficar mais claro o que cada cor representa, mas estou em dúvida se essa foi a melhor forma de colocar os quadradinhos dentro do outro. Será que seria possível automatizar os quadrados da legenda para que eu não tivesse que repetir tantas vezes a posição e as cores?
<meta charset="utf-8">

<h1>Gráfico de barras</h1>

<p>Navegadores mais usados pelos alunos da Alura em 2015 e 2016. </p>

<canvas width="600" height="400"></canvas>

<script>

    function desenhaRetangulo(x, y, largura, altura, cor) {
        var tela = document.querySelector('canvas');
        var pincel = tela.getContext('2d');

        pincel.fillStyle=cor;
        pincel.fillRect(x,y, largura, altura);
        pincel.strokeStyle='black';
        pincel.strokeRect(x,y, largura, altura);
    }

    function escreveTexto(x, y, texto) {
        var tela = document.querySelector('canvas');
        var pincel = tela.getContext('2d');

        pincel.font='15px Georgia';
        pincel.fillStyle='black';
        pincel.fillText(texto, x, y);
    }


    function escreveLegenda(x, y, texto) {
        var tela = document.querySelector('canvas');
        var pincel = tela.getContext('2d');

        pincel.font='12px Georgia';
        pincel.fillStyle='black';
        pincel.fillText(texto, x, y);
    }

    function desenhaBarra (x, y, serie, cores, texto) {

        escreveTexto(x, y - 10, texto);

        var somaAltura = 0;
        for (var i = 0; i < serie.length; i++) {

            var altura = serie[i];
            desenhaRetangulo(x, y + somaAltura, 50, altura, cores[i]);
            somaAltura = somaAltura + altura;

        }
    }


    function desenhaLegenda(x, y, cor) {

        var tela = document.querySelector("canvas");
        var pincel = tela.getContext('2d');

        pincel.fillStyle = cor;
        pincel.fillRect(x, y, 80, 70);
        pincel.strokeStyle = 'black';
        pincel.strokeRect(x, y, 80, 70);

        pincel.fillStyle = 'blue';
        pincel.fillRect(290, 87, 10, 10);
        escreveLegenda(305, 97, 'Chrome')
        pincel.fillStyle = 'green';
        pincel.fillRect(290, 102, 10, 10);
        escreveLegenda(305, 112, 'Firefox')
        pincel.fillStyle = 'yellow';
        pincel.fillRect(290, 117, 10, 10);
        escreveLegenda(305, 127, 'Safari')
        pincel.fillStyle = 'red';
        pincel.fillRect(290, 132, 10, 10);
        escreveLegenda(305, 142, 'Others')

    }

    var serie2015 = [50, 25, 20, 5];
    var serie2016 = [65, 20, 13, 2];

    var cores = ['blue', 'green', 'yellow', 'red'];

    desenhaBarra(50, 50, serie2015, cores, '2015');
    desenhaBarra(150, 50, serie2016, cores, '2016');

    desenhaLegenda(280, 80, 'white');

</script>


