Boa noite.
Ao usar a função:
                        ggplot(data=dados,aes(x=Idade))
                    geom_histogram(
                        aes(y=cumsum(..count..)/sum(..count..)),
                        bins = 10
                    )
                    geom_freqpoly(
                        aes(y=cumsum(..count..)/sum(..count..)),
                        color='green'
                    )
O R retornou a seguinte mensagem:
ggplot(data=dados,aes(x=Idade))
                        > geom_histogram(
                        +     aes(y=cumsum(..count..)/sum(..count..)),
                        +     bins = 10
                        + )
                        mapping: y = ~cumsum(..count..)/sum(..count..)
                        geom_bar: na.rm = FALSE, orientation = NA
                        stat_bin: binwidth = NULL, bins = 10, na.rm = FALSE, orientation = NA, pad = FALSE
                        position_stack
                        > geom_freqpoly(
                        +     aes(y=cumsum(..count..)/sum(..count..)),
                        +     color='green'
                        + )
                        mapping: y = ~cumsum(..count..)/sum(..count..)
                        geom_path: na.rm = FALSE
                        stat_bin: na.rm = FALSE, pad = TRUE
                        position_identity
                        >
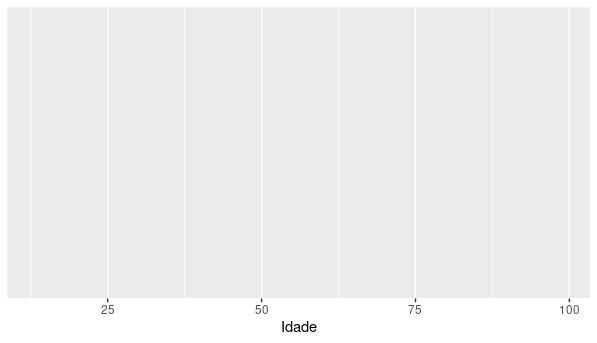
E o gráfico gerado ficou em branco, conforme imagem em anexo.
 a
a
Podem me ajudar?
Obrigado


