Para ser um gráfico de Pareto, precisaria da frequência acumulada, não?
Para ser um gráfico de Pareto, precisaria da frequência acumulada, não?
Esse também é meu entendimento.
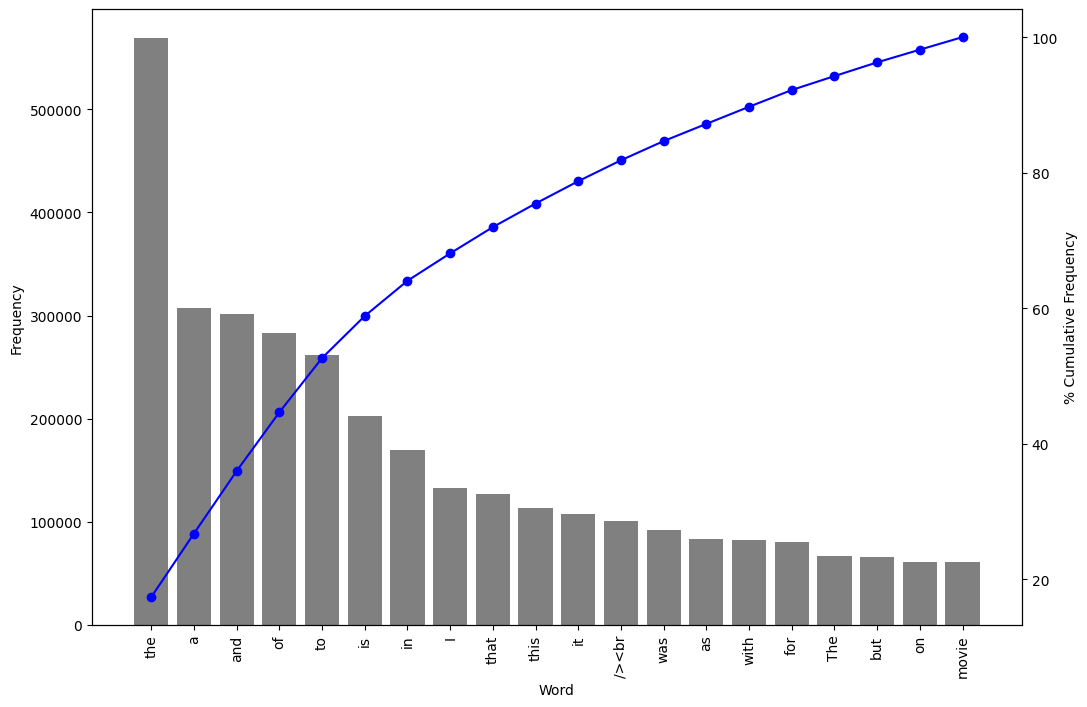
Usei esse código aqui para gerar um gráfico de Pareto que mostra a frequência acumulada:
#Visualizing the distribution
import seaborn as sns

plt.figure(figsize=(12,8))
ax = sns.barplot(data = top_20, x="Word", y="Frequency", color='gray')
#ax.set(ylabel = "Count")


# calculate the cumulative sum of the frequencies and the total frequency
cumulative_freq = top_20['Frequency'].cumsum()
total_freq = cumulative_freq.iloc[-1]

ax2 = ax.twinx()
ax2.plot(ax.get_xticks(), cumulative_freq/total_freq*100, '-o', color='blue')
ax2.set_ylabel('% Cumulative Frequency')

# set x-axis label and tick labels
ax.set(xlabel='Word', ylabel='Frequency')
ax.set_xticklabels(ax.get_xticklabels(), rotation=90)

plt.show()
Esse foi o resultado:
