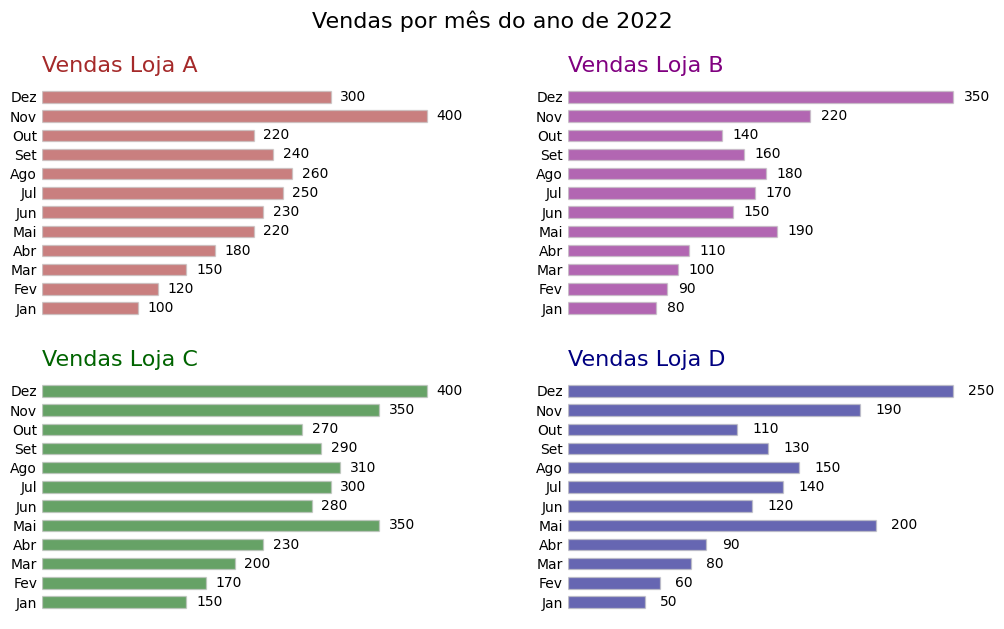
lojas = ['A', 'B', 'C', 'D']

vendas_2022 = {'Jan': [100, 80, 150, 50],
    'Fev': [120, 90, 170, 60],
    'Mar': [150, 100, 200, 80],
    'Abr': [180, 110, 230, 90],
    'Mai': [220, 190, 350, 200],
    'Jun': [230, 150, 280, 120],
    'Jul': [250, 170, 300, 140],
    'Ago': [260, 180, 310, 150],
    'Set': [240, 160, 290, 130],
    'Out': [220, 140, 270, 110],
    'Nov': [400, 220, 350, 190],
    'Dez': [300, 350, 400, 250]
}

import pandas as pd
import matplotlib.pyplot as plt
vendas_2022 = pd.DataFrame(vendas_2022, index = lojas)
vendas_2022.index.name = 'loja'
fig, axs = plt.subplots(2,2, figsize=(12,7))
fig.subplots_adjust(hspace=0.2, wspace=0.3)
fig.suptitle('Vendas por mês do ano de 2022', fontsize = 16)

cores = ['brown', 'purple', 'darkgreen', 'navy']

for i, ax in enumerate(axs.flat):
    ax.set_title(f'Vendas Loja {vendas_2022.index[i]}', loc='left', fontsize=16, color = cores[i])
    ax.barh(vendas_2022.columns,vendas_2022.iloc[i], color = cores[i], edgecolor ='silver', height = 0.6, alpha = 0.6)
    ax.tick_params(axis='both', which='both', length=0)
    ax.set_frame_on(False)
    ax.get_xaxis().set_visible(False)
    for j, v in enumerate(vendas_2022.iloc[i]):
        ax.text(v + 10, j, str(v), va='center', fontsize=10)

plt.show()