import pandas as pd
import matplotlib.pyplot as plt
url = 'https://raw.githubusercontent.com/Gabriellemga/Praticando_Python/refs/heads/main/Praticando_gr%C3%A1ficos_composi%C3%A7%C3%A3o_relacionamentos/dados/atividade_4.csv'
df = pd.read_csv(url)
df
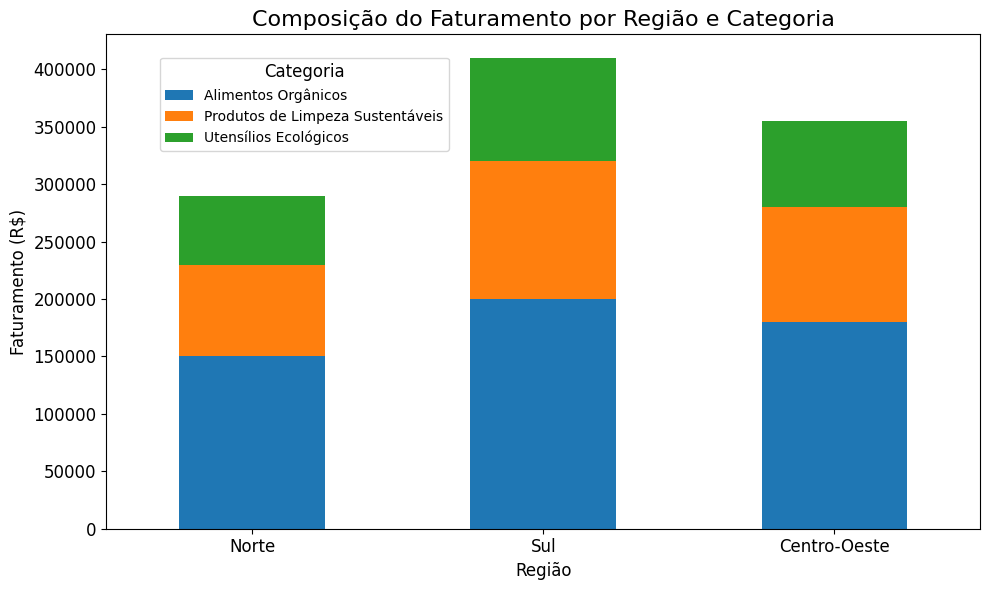
fig, ax = plt.subplots(figsize = (10,6))
df.plot(x = 'Região', kind = 'bar', stacked = True, ax = ax )
ax.set_title('Composição do Faturamento por Região e Categoria', fontsize = 16)
ax.set_xlabel('Região', fontsize = 12)
ax.set_ylabel('Faturamento (R$)', fontsize=12)
ax.tick_params(labelsize = 12, labelrotation = 0)
ax.legend(bbox_to_anchor=(0.4, 0.75), title='Categoria', title_fontsize = 12, fontsize = 10)
plt.tight_layout()
plt.show()