<!DOCTYPE html>
<html lang="pt_br">
<head>
<meta charset="utf-8">
<script type="text/javascript" src="js/graficos.js"></script>
<script type="text/javascript" src="https://www.gstatic.com/charts/loader.js"></script>
<script>
google.charts.load('current', {'packages':['corechart'], 'language': 'pt'});
google.charts.setOnLoadCallback(desenharGraficos);
</script>
</head>
<body>
<body>
<div id="graficoPizza"></div>
<div id="graficoLinha"></div>
<div id="graficoColuna"></div>
</body>
</body>
</html>
--------------------------------------------
JS
function desenharGraficos(){
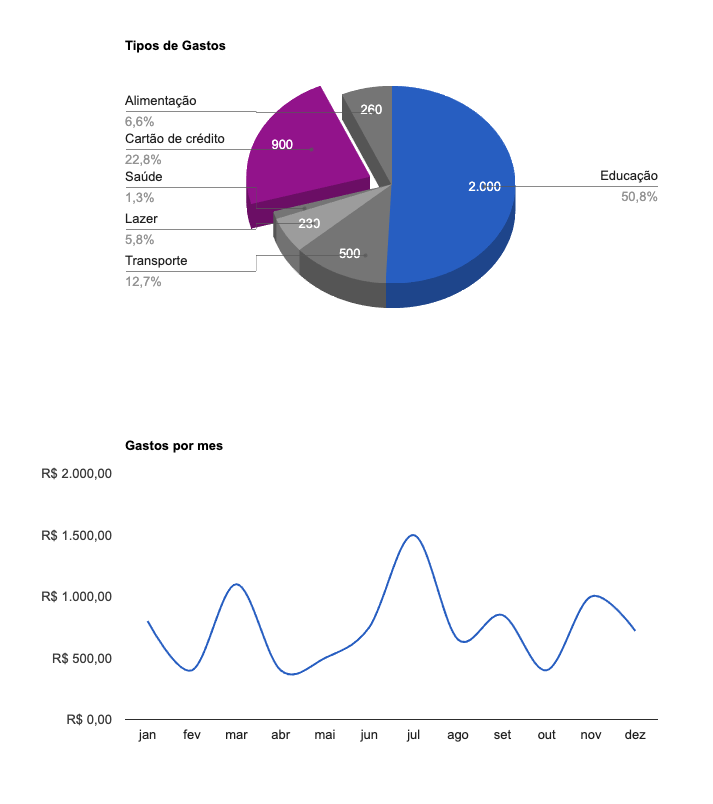
//Pizza
var tabela = new google.visualization.DataTable();
tabela.addColumn('string', 'categorias');
tabela.addColumn('number', 'valores');
tabela.addRows([
['Educação', 2000],
['Transporte', 500],
['Lazer', 230],
['Saúde', 50],
['Cartão de crédito', 900],
['Alimentação', 260],
]);
var opcoes = {
title: 'Tipos de Gastos',
height: 400,
width: 800,
is3D: true,
legend: 'labeled', //top, right, left, bottom
pieSliceText: 'value', //value, label
slices:{
0:{},
1:{color: 'grey'},
2:{color: '#a6a6a6'},
3:{color: 'grey'},
4:{offset: 0.2},
5:{color: 'grey'},
}
//colors: ['grey', 'red']
// 'pieHole': 0.8 Grafico DONUT | OBS: tem que tirar o 3D
};
var grafico = new google.visualization.PieChart(document.getElementById('graficoPizza'));
grafico.draw(tabela, opcoes);
//Linhas
tabela = new google.visualization.DataTable();
tabela.addColumn('string','mes');
tabela.addColumn('number','gastos');
tabela.addRows([
['jan',800],
['fev',400],
['mar',1100],
['abr',400],
['mai',500],
['jun',750],
['jul',1500],
['ago',650],
['set',850],
['out',400],
['nov',1000],
['dez',720]
]);
var opcoes = {
title: 'Gastos por mes',
height: 400,
width: 800,
vAxis: {
format: 'currency',
gridlines: { //tirar as linhas
count: 0,
// color: 'transparent' não precisa, depois da att o count 0 remove só as linhas
}
},
curveType: 'function', //tranformar em curvas
legend: 'none'
}
var grafico = new google.visualization.LineChart(document.getElementById('graficoLinha'));
grafico.draw(tabela, opcoes);
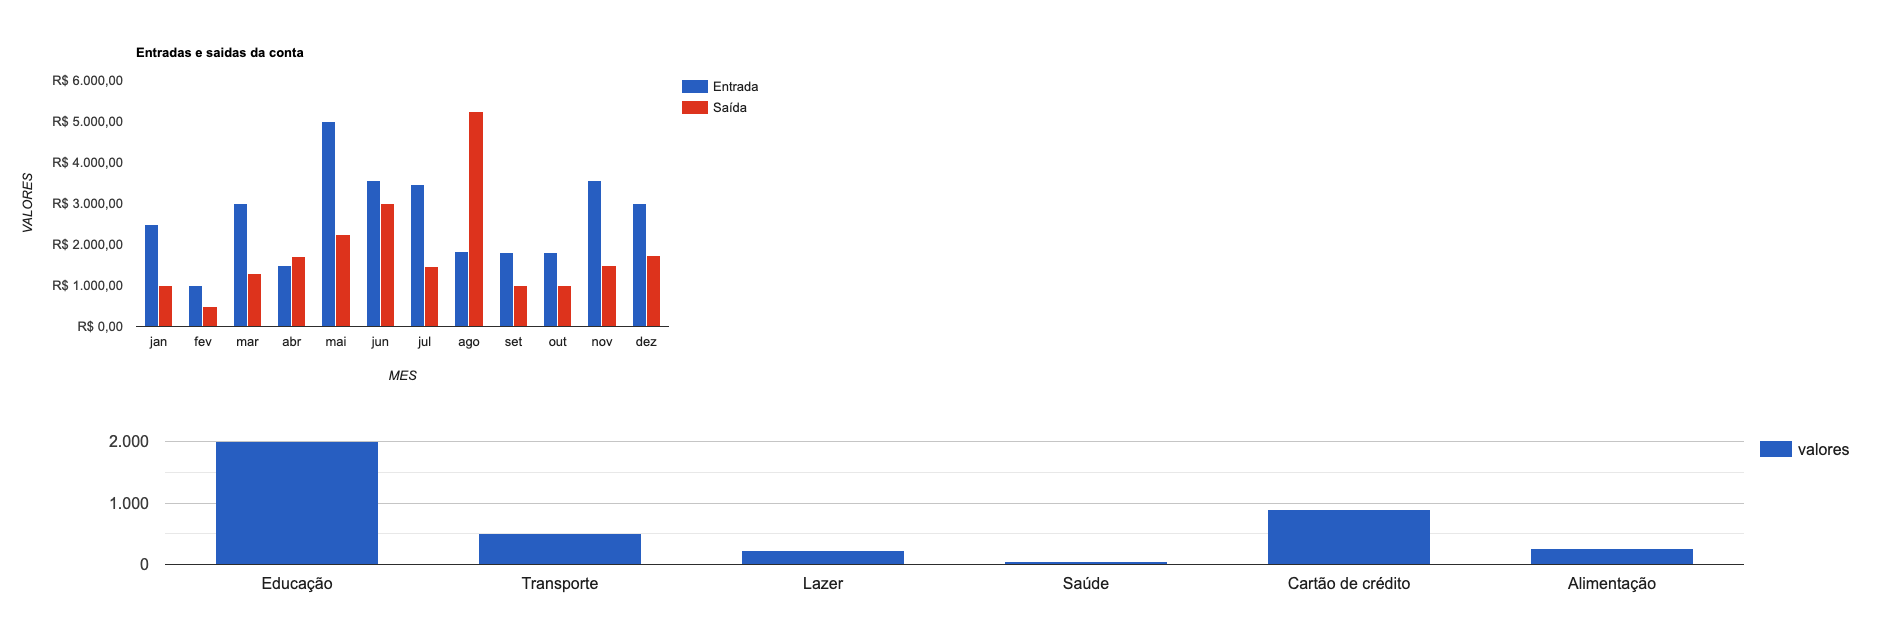
//Colunas
var tabela = google.visualization.arrayToDataTable([
['Mês','Entrada','Saída'],
['jan',2500,1000],
['fev',1000,500],
['mar',3000,1300],
['abr',1500,1700],
['mai',5000,2250],
['jun',3567,3000],
['jul',3452,1468],
['ago',1833,5250],
['set',1800,1000],
['out',1800,1000],
['nov',3569,1500],
['dez',3000,1740]
]);
var grafico = new google.visualization.ColumnChart(document.getElementById("graficoColuna"));
grafico.draw(tabela);
}
Quando eu coloco a minha function no html ele funciona normal, mas com os arquivos separados os dois primeiros gráficos aparecem e o columnChart não. Se alguem puder me ajudar agradeço haha.