
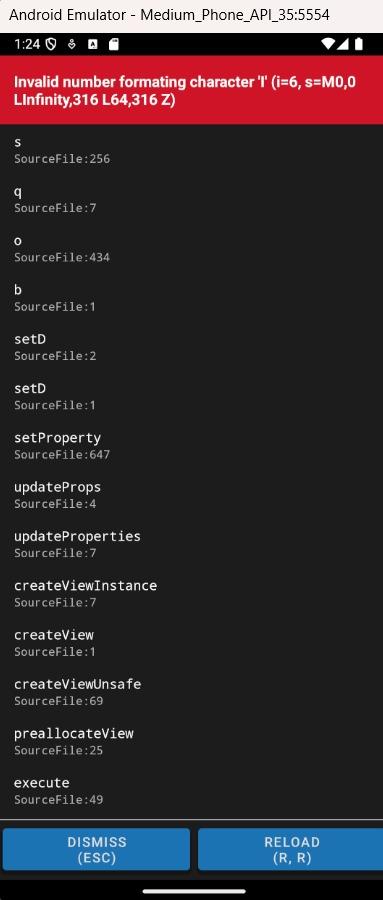
Estou enfrentando um problema com a renderização de um gráfico de mercado financeiro, onde basicamente o projeto que estou fazendo é um aplicativo de trading, porém o gráfico fica dando este erro e renderiza, e não estou sabendo resolver este problema.
 Olhe como esta o código desta parte do gráfico:
  const fetchRealTimeMarketData = (currencyPair) => {
    const streamUrl = `https://pipwars-graph-421723751484.us-central1.run.app/stream?coin=${currencyPair}&start_date=2025-01-03%2000:00:00&end_date=2025-01-03%2000:12:00`;

    // Instanciando o EventSource para conexão SSE
    const es = new EventSource(streamUrl);

    es.addEventListener("open", () => {
      console.log("Conexão SSE aberta");
    });

    es.addEventListener("message", (event: any) => {
      try {
        // Corrigir a string antes de fazer o parse
        let correctedData = event.data.replace(/None/g, "null");
        correctedData = correctedData.replace(/'/g, '"');

        const data = JSON.parse(correctedData); // Fazer o parse da string corrigida

        if (data.event === "price") {
          const price = data.price;
          const timestamp = new Date(data.timestamp * 1000).toLocaleTimeString("en-US", {
            hour: "2-digit",
            minute: "2-digit",
          });

          // Atualizar os dados do gráfico
          setChartData((prev) => {
            const updatedLabels = [...prev.labels, timestamp];
            const updatedData = [...prev.data, price];

            if (updatedLabels.length > 100) {
              updatedLabels.shift();
              updatedData.shift();
            }

            return {
              labels: updatedLabels,
              data: updatedData,
            };
          });

          // Atualizar o valor de mercado
          const lastPrice = price;
          const firstPrice = chartData.data[0] || price;
          const absoluteChange = lastPrice - firstPrice;
          const percentageChange = ((absoluteChange / firstPrice) * 100).toFixed(2);
          const isPositive = absoluteChange >= 0;

          setMarketValue({
            text: `1 ${data.symbol.split("/")[0]} = $${lastPrice.toFixed(2)}`,
            variation: `Hoje ${isPositive ? "+" : ""}${absoluteChange.toFixed(2)} (${percentageChange}%)`,
            color: isPositive ? "#28B446" : "red",
            icon: isPositive ? "▲" : "▼",
          });
        }
      } catch (error) {
        console.error("Erro ao processar evento SSE:", error);
        console.log("Dado recebido:", event.data); // Log para ajudar na depuração
      }
    });

    es.addEventListener("error", (error) => {
      console.error("Erro na conexão SSE:", error);
      es.close(); // Fechar conexão em caso de erro
    });

    // Retorna função para encerrar a conexão ao desmontar o componente
    return () => {
      es.close();
      console.log("Conexão SSE fechada");
    };
  };


<View style={[styles.chartContainer, { backgroundColor: isDarkMode ? '#141414' : '#FFFFFF', height: 380 }]}>
          <ScrollView
              horizontal
              showsHorizontalScrollIndicator={false}
              ref={scrollViewRef}
              contentContainerStyle={{paddingHorizontal: 10}}
          >
            <LineChart
                data={{
                  labels: chartData.labels, // Labels dos timestamps
                  datasets: [
                    {
                      data: chartData.data, // Dados dos preços
                    },
                  ],
                }}
                width={chartData.labels.length * 50} // Largura do gráfico
                height={400} // Altura do gráfico
                //yAxisLabel="$" REFERENCIA A MOEDA USADA
                chartConfig={{
                  backgroundColor: isDarkMode ? "#1E2923" : "#FFFFFF",
                  backgroundGradientFrom: "#08130D",
                  backgroundGradientTo: "#1E2923",
                  decimalPlaces: 2,
                  color: (opacity = 1) => `rgba(26, 255, 146, ${opacity})`,
                  labelColor: (opacity = 1) => `rgba(255, 255, 255, ${opacity})`,
                  propsForLabels: {
                    fontSize: 8
                  },
                  style: {
                    borderRadius: 16,
                  },
                  propsForDots: {
                    r: "6",
                    color: "#28B446",
                    strokeWidth: "1",
                    stroke: "#ffa726",
                  },
                }}
                bezier // Torna o gráfico mais suave
                style={{marginVertical: 8}}
            />
          </ScrollView>
        </View>

