import pandas as pd
import matplotlib.pyplot as plt
import plotly.graph_objects as go
url = 'https://raw.githubusercontent.com/Gabriellemga/Praticando_Python/refs/heads/main/Praticando_gr%C3%A1ficos_composi%C3%A7%C3%A3o_relacionamentos/dados/atividade_3.csv'
df = pd.read_csv(url)
df
fig = go.Figure(go.Waterfall(name = '', orientation = 'v', measure = df['Tipo'], x = df['Categoria'], y = df['Valor'],
text = [f'R$ {v:,.2f}' for v in df['Valor']],
textposition = 'outside', connector_line = {'color': '#555655'},
totals_marker = {'color':'#174A7E'}, decreasing_marker = {'color':'#C3514E'}
)
)
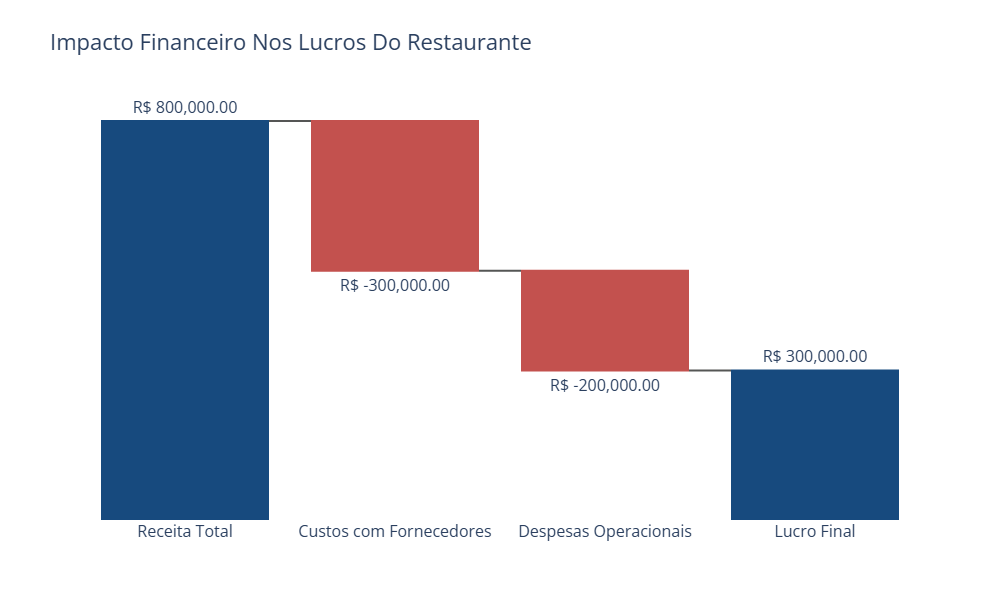
fig.update_layout(title = 'Impacto Financeiro Nos Lucros Do Restaurante', font_size = 16 ,
plot_bgcolor = '#FFFFFF', width=1000, height=600)
fig.update_yaxes(showticklabels=False)
fig.show()